Sometimes, especially when you’re new to HTML and CSS, your website isn’t appearing the way you want it too. Things might be the wrong color, or appearing in the wrong place, or not appearing at all!
There are many ways to debug your HTML and CSS, but here are four options that anyone can try:
- Look at the colors in your code editor
- Inspect Element in Google Chrome
- Validator
- Rubber Duck Debugging
1. Look at the colors in your code editor.
You’re probably writing your website using a code editor, like Notepad++ or Atom. There are many different programs, but they all do something called syntax highlighting. Basically, it figures out what programming language your file is written in, and then changes the colors of the text to highlight the different pieces.
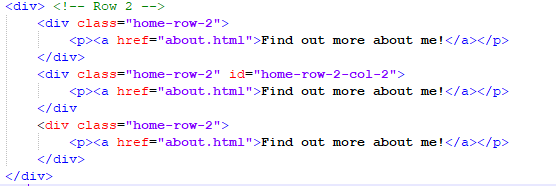
In HTML, this is great for finding when you have a missing >, or quote mark, or similar error. Your HTML tags will suddenly change color. As an example, the following picture is missing a > for a closing div tag. The code editor is showing this by changing the color of the next opening tag (another div) in red, instead of the normal blue.

In CSS, you can see a similar thing if you forget a semi-colon or a curly bracket – it’ll change the color of the next element.
2. Inspect Element in Google Chrome
If you open your webpage in Google Chrome, you can right click on it and choose the Inspect option. This will open the Inspect Element tool, which is used to see what the webpage looks like to Google Chrome. You can use this to find missing tags in your HTML.
If you right click on the issue you’re trying to fix, then Inspect, you can see how Google Chrome views your HTML. Compare this with the HTML in your code editor, and see how it’s different. If you’re missing a tag, you’ll see sections closing earlier than expected, or appearing higher in the page than expected.
3. Validator
The Validator is a tool for seeing if your HTML matches the HTML standard. At that page, you can upload your HTML file, and it will show you all of the ways it differs from the HTML standard.
The reason this is third on the list is that it can give you a lot of errors that your web browser (Chrome, Firefox, etc) doesn’t care about. However, it is an excellent tool for finding missing tags or related mistakes. It will give you a line number for where the problem is found, and it’s usually the line right above that one where the mistake is. It will also suggest why the problem is happening, and is usually very accurate – a missing > or quote mark or similar.
4. Rubber Duck Debugging
If none of those work, it’s time to do some Rubber Duck Debugging. This is a fairly simple process where you ask yourself questions about the problem you’re seeing (originally talking to a rubber duck, but it works talking to anything!). It encourages you to verbalize your thoughts, and can help you realize things you haven’t considered yet.
It is less helpful for missing tags or quote marks, but works well for if you are confused about something not appearing or working the way you expect it to.